Why I Built My Own Load Testing Framework
Because every tool I tried either couldn’t test SignalR properly or got the math wrong.
The Problem
I needed to load test a SignalR hub under real conditions. Thousands of persistent connections, bidirectional messaging, real hub invocations.
Every tool I tried did one of these:
- Ignored SignalR entirely - HTTP-only, no WebSocket support
- Faked it - raw WebSocket frames pretending to be SignalR
- Required a different language - write your scenario in JavaScript/Go/Python, then somehow test your .NET server
None of them spoke SignalR natively. None of them used the actual Microsoft.AspNetCore.SignalR.Client.
So I built one that does.
What AnPerf Is
AnPerf is a distributed performance testing framework written in .NET 8.
Your load test scenario is just a C# class. No DSL. No scripting language. No YAML-driven protocol translation. You write .NET code to test .NET apps.
 1public class MySignalRScenario : IScenario
 2{
 3    private readonly HubConnection _hub;
 4
 5    public MySignalRScenario(string targetUrl)
 6    {
 7        _hub = new HubConnectionBuilder()
 8            .WithUrl($"{targetUrl}/hub")
 9            .Build();
10    }
11
12    public async Task ExecuteAsync(IStepContext context)
13    {
14        await context.Step("Connect", async () =>
15            await _hub.StartAsync());
16
17        await context.Step("InvokeMethod", async () =>
18            await _hub.InvokeAsync("SendMessage", "hello"));
19
20        await context.Step("Disconnect", async () =>
21            await _hub.StopAsync());
22    }
23}
That’s it. Real SignalR client. Real hub connection. Real metrics per step.
Architecture
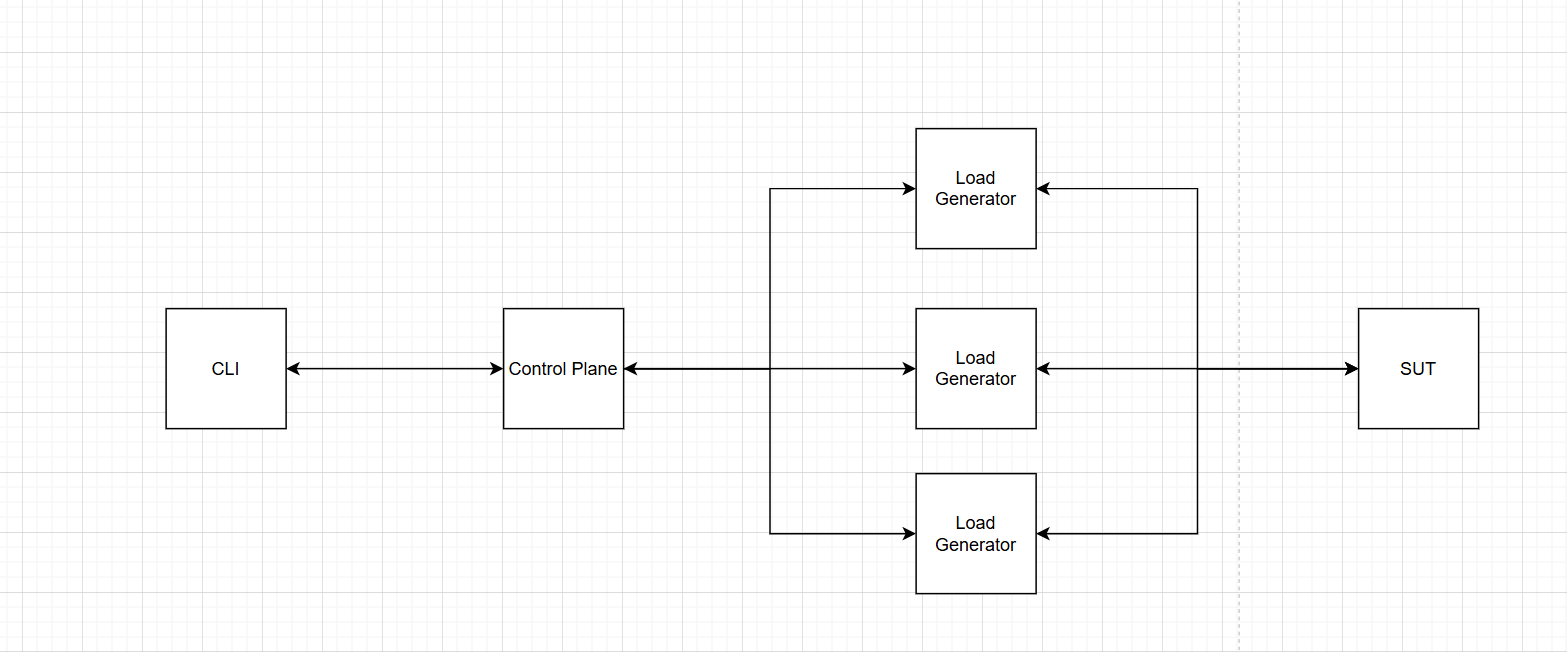
AnPerf has three layers:
1. The Framework
The core performance engine. Handles scheduling, metrics, and protocol adapters.
- Schedulers - closed-model (fixed VUs) and open-model (target RPS), both using monotonic timing
- Metrics - lock-free sharded histogram with 256 logarithmic buckets, zero allocation on the hot path
- Protocol adapters - native clients for HTTP, TCP, WebSocket, and SignalR
2. The Control Plane
Distributed orchestration. An orchestrator manages remote agents via WebSocket.
- Provisioning — SSH into remote machines, deploy the agent binary, start it
- Job dispatch — send test jobs to agents via bidirectional WebSocket
- Result aggregation — merge raw histogram buckets from all agents, recompute percentiles
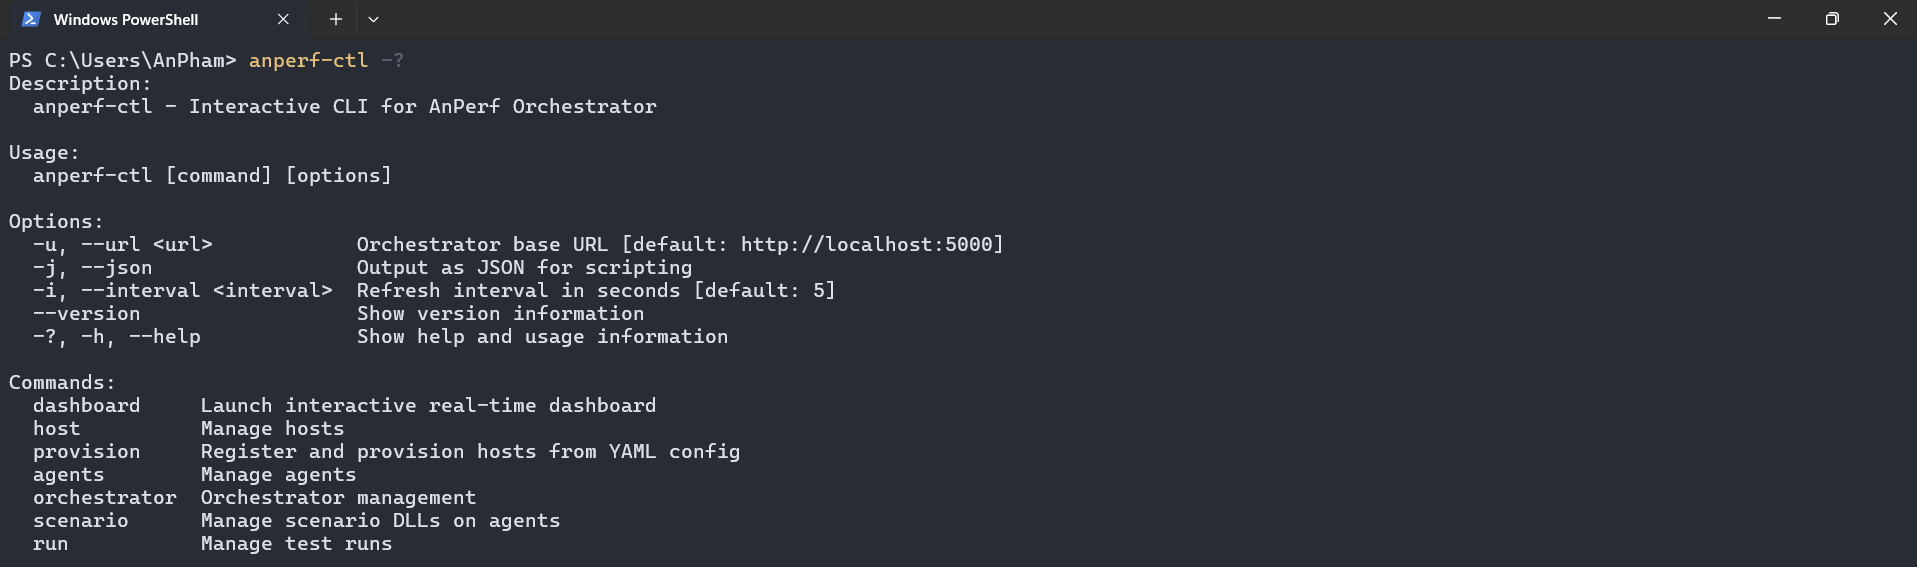
3. The CLI
A single command-line tool to control everything.
 1# Add remote machines
 2anperf-ctl add-host --ip 10.0.0.10 --user deploy --key ~/.ssh/id_rsa
 3
 4# Provision agents via SSH
 5anperf-ctl provision --all
 6
 7# Push your scenario DLL (with content hash — only uploads once)
 8anperf-ctl scenario push --name signalr-test --path ./publish/
 9
10# Run the test
11anperf-ctl run start --file job.yaml --scenario signalr-test
12
13# Watch it live
14anperf-ctl dashboard
Control options:
Design Decisions That Matter
Lock-Free Hot Paths
Every request your virtual user makes goes through the metrics recording path. If that path takes a lock, you’re measuring your own overhead — not the server’s performance.
AnPerf uses a sharded histogram — each thread writes to its own shard, no contention. Shards are merged only when you read the results. Recording is zero-allocation: no new, no boxing, no string operations.
Monotonic Timing
Never use DateTime.UtcNow for measuring latency. It drifts, it jumps, it lies.
AnPerf uses Stopwatch.GetTimestamp() everywhere. Monotonic. Nanosecond resolution. No surprises.
Correct Percentile Merging
This is the one most tools get wrong.
When you have 3 agents each reporting p99 = 12ms, 14ms, 11ms — the aggregate p99 is not the average (12.3ms). That number is statistically meaningless.
AnPerf agents send raw histogram bucket arrays (long[256]) back to the orchestrator. The orchestrator sums bucket counts element-wise, then recomputes percentiles from the merged distribution. Mathematically correct.
Agent 1: [0, 0, 5, 12, 45, 102, ...]  // 256 buckets
Agent 2: [0, 0, 3, 18, 52,  98, ...]
Agent 3: [0, 0, 7, 15, 41, 110, ...]
─────────────────────────────────────
Merged:  [0, 0, 15, 45, 138, 310, ...]  → recompute p50, p90, p99
Scenario Push ≠ Test Run
Uploading a 50MB DLL to 10 agents takes time. Running a test should be instant.
AnPerf separates these: scenario push uploads via SSH with content-hash deduplication (skip if unchanged). run start just sends a WebSocket command. Second run? Instant — no upload needed.
The report from Orchestrator
The report is currently suport Json format.
1  "summary": {
2    "total_requests": 34861,
3    "total_errors": 0,
4    "error_rate_pct": 0,
5    "throughput_rps": 1809.9,
6    "agent_count": 1,
7    "total_vus": 0
8  },
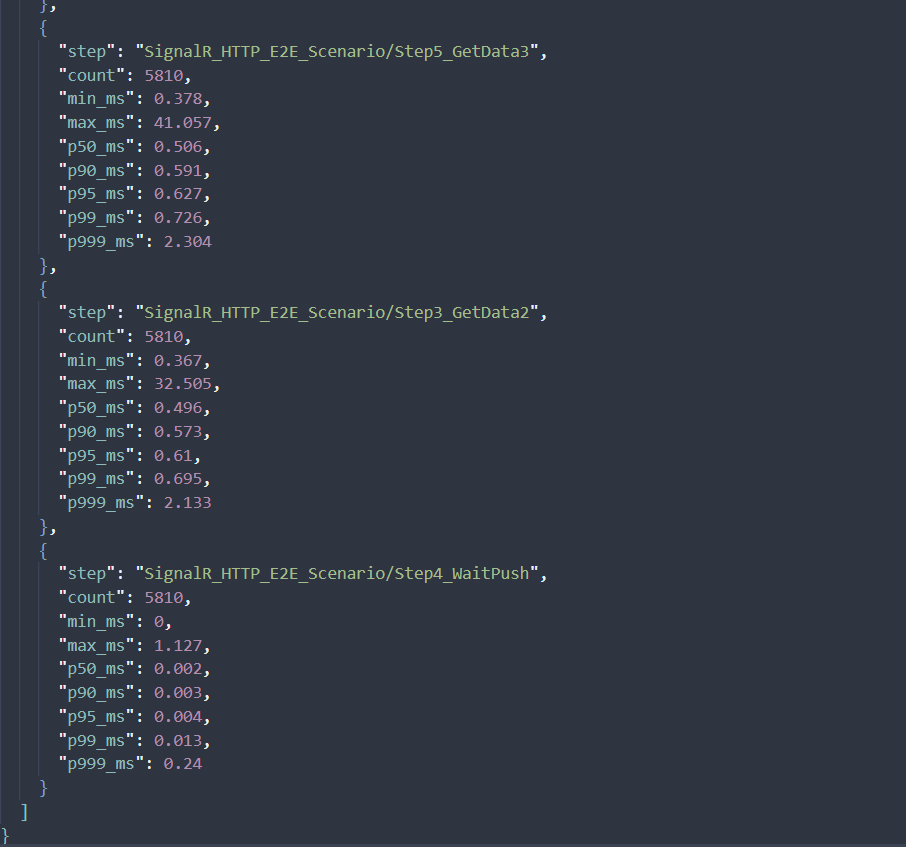
Sample test run using AnPerf (SignalR + HTTP E2E scenario):
At ~1.8k RPS with a single agent, the system maintains sub-millisecond latency across the entire flow. HTTP steps consistently stay around ~0.5 ms at p50 and below 1 ms at p99, indicating no contention or queuing under load. SignalR push latency is near-instant (p99 ~0.013 ms), showing an efficient real-time pipeline with no delivery backlog.
A few outliers (~40 ms) appear at the extreme tail, but they are rare and do not impact overall user experience.
This is a strong baseline for a low-latency, real-time system.
What a Test Run Looks Like
Define your workload in YAML:
 1scenario:
 2  name: "MySignalRScenario"
 3  targetUrl: "http://target-server:5000"
 4
 5workload:
 6  model: "closed"
 7  stages:
 8    - kind: "rampUp"
 9      duration: "30s"
10      startTarget: 1
11      target: 200
12    - kind: "steady"
13      duration: "5m"
14      target: 200
15
16agents:
17  count: 3
18  labels:
19    region: "ap-southeast-2"
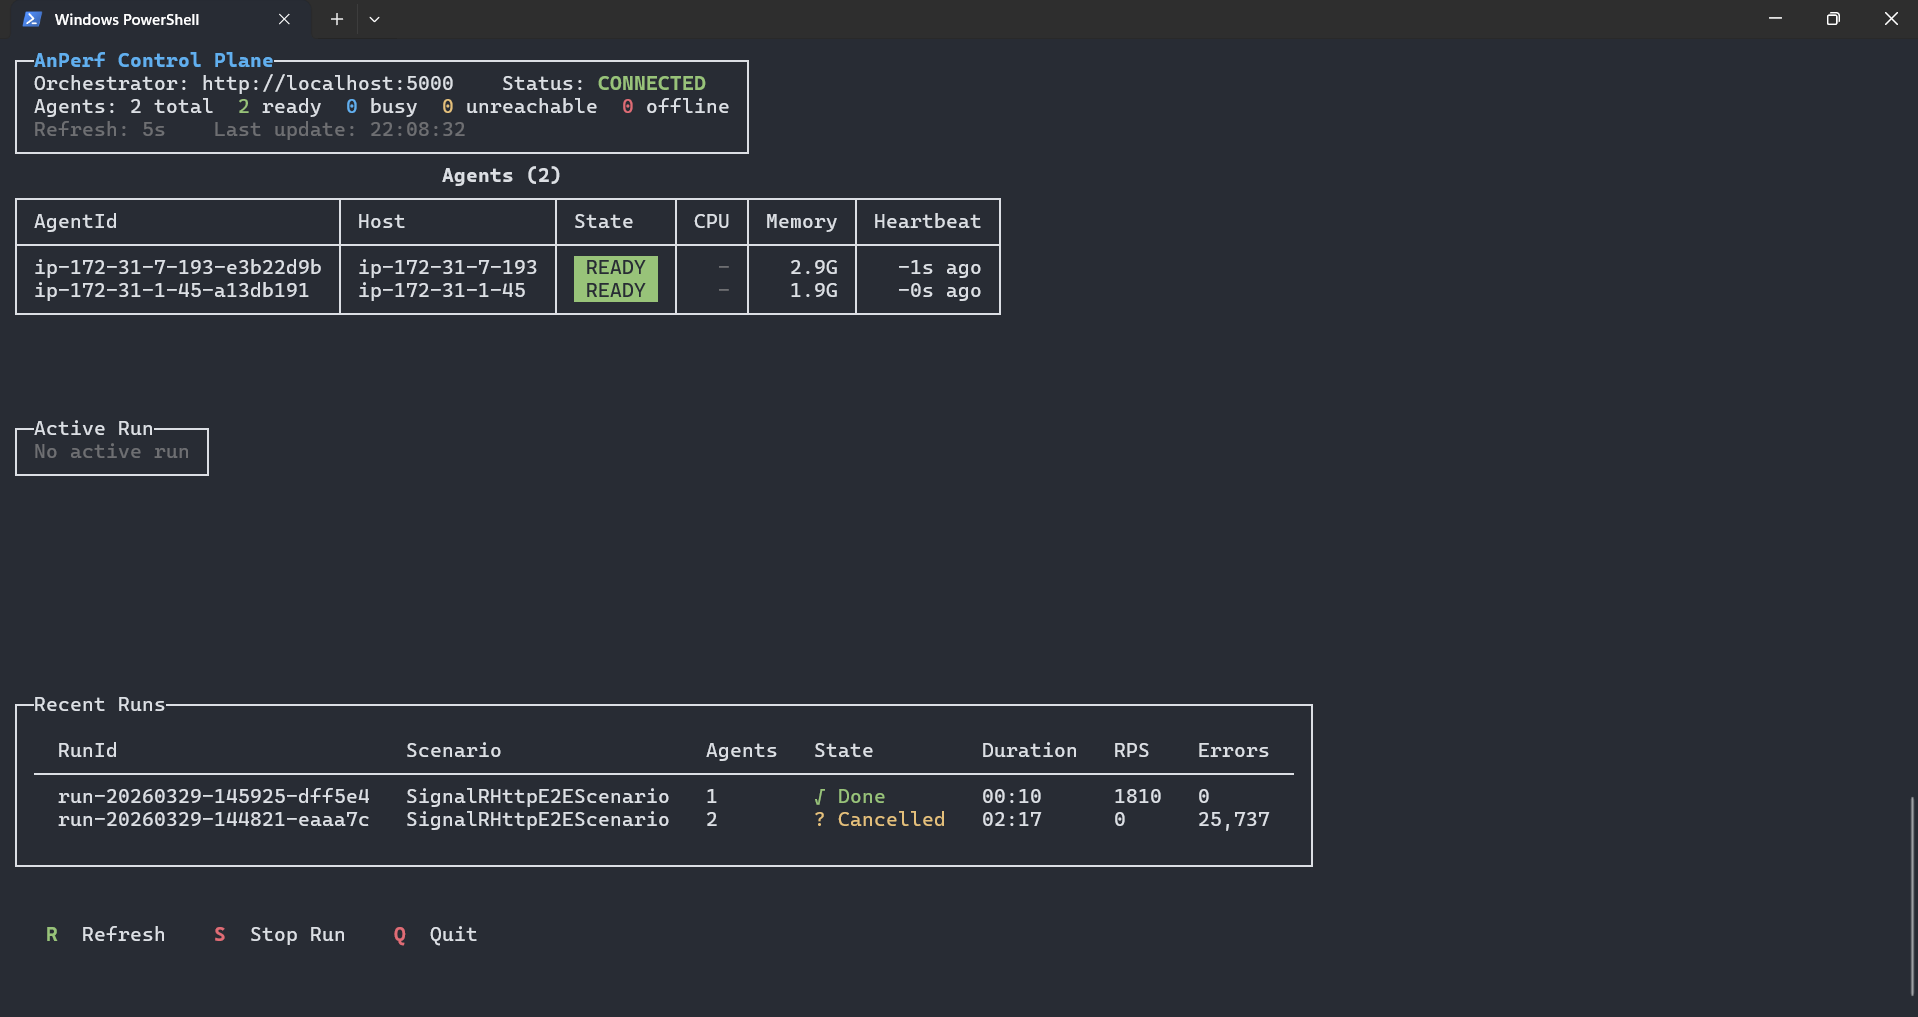
The live dashboard shows everything:
(I will update the image later)
┌─ Active Run ────────────────────────────────────────────────────────┐
│ Run: run-01   Scenario: signalr-test   State: ● Running         │
│                                                                 │
│ Agent            Status     VUs   RPS     Errors  p99 (ms)      │
│ agent-1-abc123   Running    200   4,521   3       12.4          │
│ agent-2-def456   Running    200   4,388   1       13.1          │
│ agent-3-ghi789   Running    200   4,102   0       11.8          │
│                                                                 │
│ ─── Aggregate ───────────────────────────────────────────────────   │
│ Total VUs: 600   RPS: 13,011   Errors: 4   p50: 2.1   p99: 12.8 │
└───────────────────────────────────────────────────────────────────────┘
Per-agent breakdown. Aggregate metrics computed correctly. Real-time refresh.
Current State
This is v1. It works. It runs really well.
But it’s not open-source yet.
The internals are solid - lock-free metrics, correct aggregation, clean distributed architecture. But the developer experience isn’t where I want it to be. Setting it up still requires too many manual steps. The documentation doesn’t exist yet.
The plan: polish the setup experience, write proper docs, and open-source it when it’s ready for anyone to use - not just me.
What I Learned
Building this taught me more about performance than any blog post or course:
- You can’t measure performance with tools that have performance problems. The measurement infrastructure must be faster than what you’re measuring.
- Lock-free programming is hard but necessary. Once you see what contention does to your numbers at scale, you can’t unsee it.
- Distributed aggregation has real math. Averaging percentiles is wrong. Averaging averages is wrong. You need raw data.
- Separation of concerns saves time. Splitting upload from execution, provisioning from runtime — each decision made the system simpler and faster.
What’s Next
- Polish the CLI experience
- Write documentation and getting-started guides
- Add more protocol adapters
- Open-source it
If you’re interested in .NET performance, distributed systems, or load testing — stay tuned.
Built with .NET 8, tested with real SignalR hubs, and measured correctly.